


This paper investigates the impact of stack effect and pressure differentials on infiltration-driven heating and cooling loads in supertall and megatall buildings. Traditional assumptions of 0.2 air changes per hour (ACH) underestimate infiltration, especially above 300 meters. The study introduces a refined method for calculating the Neutral Pressure Level (NPL), accounting for façade and internal leakage. Using pressure distribution models and flow resistance analogies, it quantifies infiltration and exfiltration across heights under varying wind, temperature, and HVAC pressurization. Results show major deviations in energy demand from standard models, with winter infiltration nearly doubling heating loads. The findings stress the need for height-sensitive infiltration modeling to inform HVAC sizing and energy simulations.
The Influence of Stack Effect and Other Pressure Forces on Infiltration Heating and Cooling Loads
Abstract
1. Introduction
Calculating a building’s heating and cooling loads is one of the fundamental calculations required to determine the capacity and performance of a building’s heating and cooling systems. During the past 10-15 years, supertall (300 m) and megatall buildings (600 m) have emerged. The components of heating loads are transmitted through the building envelope and infiltration. For supertall and megatall buildings, the infiltration due to pressure differentials across the building envelope can provide more infiltration than the 0.2 air changes per hour (ACH) commonly used in heating and cooling load calculations.
Infiltration is caused by a negative pressure difference (P_in – P_out) acting across an envelope to drive air in. That envelope is inevitably not perfectly sealed; the inward pressure forces air to enter the building through cracks and gaps. The analogous phenomenon to infiltration for positive pressure differences across the façade is exfiltration, where air is driven outwards. In general, only infiltration adds to a building load. While exfiltrating conditioned air represents an energy loss, it does not constitute a load; only the incoming air does. Each floor in a building can have either infiltration, exfiltration, or a combination of both due to differential wind pressure or be effectively neutral to ambient conditions in the absence of wind. The location where the indoor/outdoor pressure difference is zero for a calm wind scenario is called the neutral plane level or neutral pressure level (NPL). The terms are synonymous, and in this paper, we use the term “neutral pressure level”. As one moves further away from the NPL, the rate of infiltration/exfiltration due to the stack effect increases.
Floors with higher infiltration would typically see a higher load to the system. Floors can also have both infiltration and exfiltration: this is usually caused by differential wind pressures, where the windward side experiences a greater inward wind pressure, and the leeward side of the building experiences an outward pressure.
The location of the NPL is an important parameter in calculating the pressure distribution. For a single-zone building of any height, the NPL is typically located mid-height, halfway up the building, with no internal flow resistance, a uniform envelope, and floor-to-floor leakage distribution. This discussion will include the importance of the NPL, how it is determined, and how it moves based on wind, HVAC pressurization, and outdoor temperature.
Ambient temperature is a function of altitude, complicating the calculation of system loads. For tall buildings (e.g., greater than 300 m), the T(z) relationship can become important to the overall heat gain or loss to any space in the building. When the infiltrating air has a different temperature from that inside, it represents a heat gain (if T_out is greater than T_setpoint) or heat loss if (T_out is less than T_setpoint) for a mechanical system. Under natural ventilation or economizer operations, that infiltration can be useful if T_out is less than T_setpoint, but not at an outdoor temperature far from the setpoint temperature.
The infiltration rate through any building envelope area is governed by two parameters: the pressure difference across the envelope and the leakage rate of that façade element. However, both of those parameters are dependent on a variety of factors. The façade leakage rate will depend on the façade type, the number of operable components, its age, and construction quality. The pressure difference will depend on wind speed coupled to the building’s wind exposure, as well as stack effect and HVAC pressurization. These factors can weigh more heavily on tall buildings, because the stack effect and wind-driving forces are greater than those for shorter buildings.
As should be clear, one of the uncertainties facing building designers is understanding the overall impacts of the stack and wind effects and the loads they can cause. Not much material exists on infiltration loads for supertall and megatall buildings. This paper aims to analyze the loads to the system that the stack effect can impose on a building and how wind and pressurization from HVAC systems modify those loads.
If infiltration is important to the calculation of building energy demands, and the stack effect is important to the prediction of infiltration, then the location of the NPL becomes important to the calculation of energy on a floor-by-floor basis. The floor-by-floor distribution of building energy demand can influence equipment sizing, and, in the case of super- and mega-tall buildings, the equipment sizing could be different from one mechanical level to another located several hundred meters up or down.
This paper provides a novel way of accurately calculating the NPL specific to the relationship between the building envelope openings and internal openings such as elevator doors and staircases. The method assumes that the major resistance to flow is the envelope itself, rather than internal barriers, which is important. Ultimately, the location of the NPL depends on the building’s ability to resist airflow. If the internal pressure losses exceed those at the envelope, they dominate the analysis.
The resistance of the envelope includes the summed contribution of the fixed façade, operable windows, doors, louvers, vents, etc. Flow can enter through gaps in the fixed components, window and door openings, HVAC louvers, and other dampened openings. The internal flow passages include hallways, ceiling plenums, vertical chases, stairwells, and elevator shafts. The internal resistances along these internal flow paths include swing doors, elevator doors, cracks, and air transfer louvers.
For details of areas and leakage rates, see ASHRAE Fundamentals, chapters 16 and 24 and the ASHRAE Applications Handbook, chapters 4 and 54. One way to view the flow resistances is analogous to electrical circuits; the flow network established by the passages within the building (hallways, chases, shafts), driven by pressures imposed from stack effect (e.g., voltage) and the resistances across doors, walls, façades, and louvers, etc., creates a resistance network.
The interaction between mechanical ventilation system operation and envelope airtightness has been discussed for many years for low-rise buildings. There is less published experience for high-rise (meant here to imply tall, supertall, and megatall buildings). In a high-rise, HVAC pressurization will change the pressure but might not make the full building positive to the outside at all levels. This will depend on the degree of pressure the building systems apply and the outdoor temperature. This is where the location of the neutral plane depends on the outside temperature, which is different from that of a neutral HVAC-pressured building.
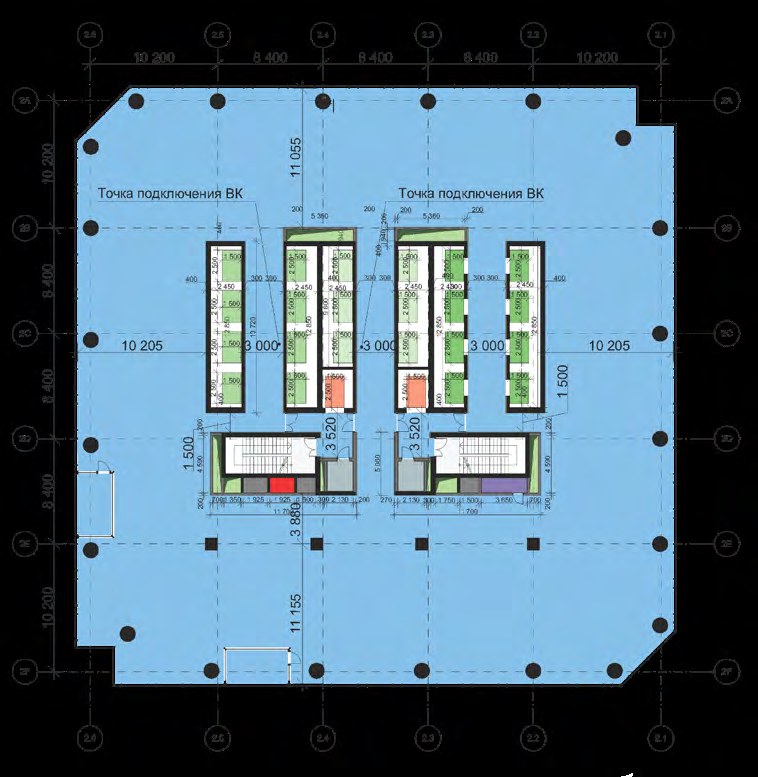
Figure 1— Typical floor plan of the building under consideration, which includes two emergency staircases and two freight elevators. Courtesy Jahn.
2. Methodology
This paper estimates the pressure difference between the core of a mega-tall building and ambient conditions using different outside weather conditions (e.g., temperature and wind). Then, it demonstrates the impact on infiltration and energy demand. For this study, we assumed two elevators and two emergency egress stairs in the core (see Figure 1). To simplify calculations, we assumed the two elevators and emergency stair shafts behave as a single shaft. This is reasonable, as they act in parallel across the height of the building. The leakage area calculations of the façade and those of the interior shafts include both crack leakage and that of doors at ground level for the façade and all levels for the shaft. For further details on the Stack Effect and how to calculate Stack Effect, we refer to the CTBUH Technical Guide Stack Effect in Tall Buildings.
3. Calculations of the Neutral Pressure Level
As noted earlier, the neutral plane/pressure level (NPL) location is often assumed to be half of the building height; however, this is not always true, and the NPL should be calculated for each application. Calculating the neutral plane then requires estimating the capacity of the network to carry flow. If one assumes the internal resistance is negligible or small relative to that at the façade, and the conductance for flow to leak through the façade is effectively linear on flow area, then the NPL can be estimated as the crack area weighted height of each of the façade openings. However, the resistance across the façade may not be the dominant constraint. Apartment buildings that are normally ventilated may have relatively porous façades but tight unit doors.
Hence, the more complete approach is to calculate an effective conductance on each floor, based on the sum of crack areas in series and parallel on each floor, and then calculate a height-weighted average, which could be turned into an estimate of the NPL. That said, if the internal resistance is low, the façade resistance dominates, and the calculation is more straightforward. This has benefits for tall building design as well as the design of natural ventilation systems in shorter buildings. A quick method of calculating the neutral plane of a building is as follows:
This calculation is effectively a crack area weighted height calculation. The opening areas on each floor include the open doors and windows and the cracks/minor leakage paths in the façade. One would use the crack areas when calculating the NPL of a “static” or neutral building. The floor areas would include the other openings to determine the NPL of a “living” building or one using natural ventilation. It should be obvious that the equation could be used to calculate the NPL using each opening. For a natural ventilation calculation, where the leakage areas are small relative to the natural ventilation openings, the crack areas can be effectively ignored, with only the areas of the natural ventilation opening included.
This neutral plane estimate can evaluate the distribution of pressures and potential flow rates throughout the building. The equation intuitively shows that opening a door at the bottom of the building will pull the NPL downwards.
4.1 The Influence of Net Ventilation System Over or Under Pressure on NPL
The ventilation system also influences the pressure distribution within the building. Mechanical ventilation systems can provide a positive or negative pressure to each floor, often delivering an oversupply of outdoor air into the building to create a positive pressure to outside conditions. In a low-rise building, this might result in the entire building being positive to the outdoors. In a high-rise building, this is not so clear, as the stack effect pressure might overwhelm that created by the ventilation system.
For buildings in winter/heating conditions, the ventilation (HVAC) system can move the neutral plane down (positive pressurization) or up (negative pressurization) relative to the position under neutral (static or zero) HVAC pressurization. Conservation of mass requires that the interior static pressure adjusts, so that the sum of all airflows through openings in the building envelope, plus the net HVAC equipment-induced airflows, balance to zero. To predict these changes in pressure differences and airflow rates caused by mechanical equipment, the location of each opening in the envelope and the relationship between pressure difference and airflow rate for each opening need to be known.
Figure 2 presents the same baseline pressure difference for the calm-condition scenario and four plots of varying HVAC pressurization. As can be seen, positive pressurization moves the NPL downwards, while net negative pressurization moves it upward. This will impact the overall infiltration/exfiltration, which will be discussed later.
The neutral plane’s location has shifted based on the HVAC pressurization for winter and summer conditions. However, the amount of shift varies for summer and winter conditions as the temperature difference is different.
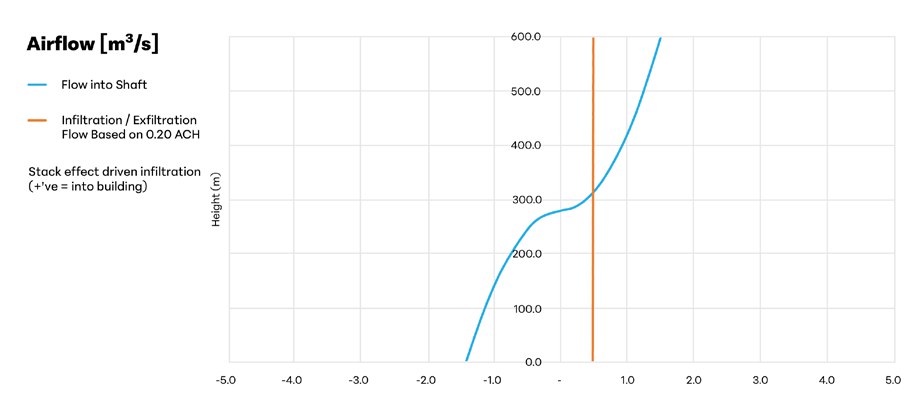
Figure 5— Indoor-outdoor pressure difference [Pa] driven by winter stack effect with different HVAC pressurization imposed as functions of height [m].
4.2 Influence of Variable Density on Predictions
As described earlier, stack effect pressure is the difference in the indoor/outdoor hydrostatic pressures caused by the difference in the weight of the columns of air located inside and outside a building. The pressure difference depends on the density and the height of interest above a reference point, usually the neutral pressure level (NPL). Air density is a function of local barometric pressure, temperature, and humidity ratio. As a result, using standard conditions to calculate density and the assumption of constant outdoor temperature can result in deviations in the actual value of the stack effect pressure.
If one assumes an adiabatic lapse rate of -0.0065°C/m and adjusts pressure as a function of height using standard equations from ASHRAE, the results in Figure 2, which presents the stack effect pressure difference in winter with wind overlaid, change, and become the form shown in Figure 3. The same calculation for summer results is duplicated in the data presented in Figure 4. An important aspect of Figure 4 near the top of the building is that the pressure difference on the upper levels has started to shift back to a winter mode (e.g., a positive slope). This is because the temperature difference decreases as one moves up the building. The imposition of wind pressures has changed the overall pressure distribution to behave like a winter scenario. If the building were taller, the indoor-outdoor temperature difference would become positively higher.
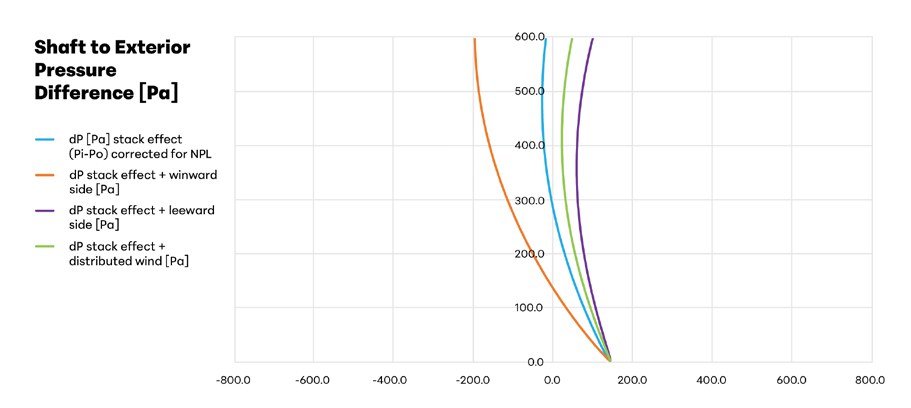
Figure 2— Indoor-outdoor pressure difference [Pa] driven by winter stack effect, with 20 Pa HVAC pressurization at different ambient temperatures as functions of height [m].
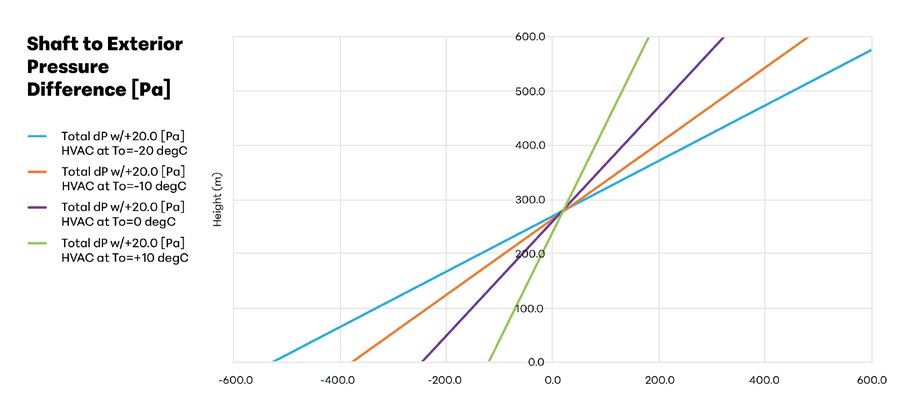
Figure 3— Indoor-outdoor pressure difference [Pa] driven by stack effect in winter with wind influences, temperature and density as functions of height [m].
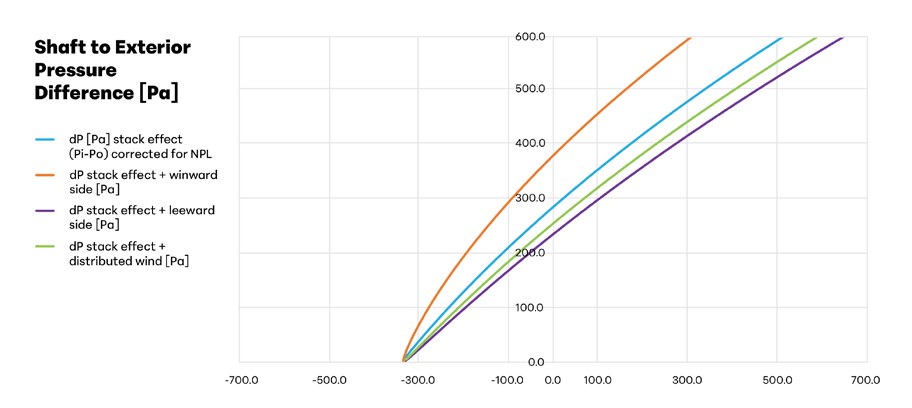
Figure 4— Indoor-outdoor pressure difference [Pa] driven by stack effect in summer, with wind influences, temperature and density as functions of height [m].
4.3 Stack Effect Driven Infiltration/Exfiltration
The flow rate passing through an opening is a function of the pressure difference and the pressure loss characteristics of the opening. In the case of the fixed elements of the envelope, the opening is a crack or gap through which infiltration or exfiltration occurs. That flow rate can be calculated using the equation (2).
This equation gives the flow rate through an opening with a particular pressure-loss characteristic. Note that it is linear in the opening area. Hence, one can calculate the flow rate through the entire envelope if the full crack area is known for the various envelope elements (e.g., façade, louvers, operable components, etc.) along with the pressure difference distribution assumed by those different elements.
Herein lies the challenge: A typical building has several components, such as exterior conditions and elevator or stair shafts. The stack effect pressure difference is the interior-shaft-to-outdoor condition. Hence, any other obstructions between the exterior and the interior shaft must be acknowledged when calculating the flow infiltrating the building. A second complication is that there are typically multiple shafts within a building—whether that be an elevator stairwell or riser. This, too, needs to be included in any detailed calculations, as a relatively leaky elevator door will accommodate more flow than a tight stairwell door.
Figure 5 shows the shaft-to-exterior pressure difference with different HVAC pressures. Outside conditions are variable density and include wind pressure. The neutral pressure levels for the alternatives are higher than the 277 m first calculated for the NPL.
The assumptions offer some limitations to this calculation. A similar air density at the façade and elevator door implies that the air temperature leaking through is the same. This is reasonable for exfiltration, but less so for infiltration. The limitation to the internal elevator shaft implies that other shafts are well-sealed. Finally, when summing up the overall flows into and out of the building, the net flow is necessarily zero. These results from the current spreadsheet calculations do not match the predictions for the floor-to-floor differential. A more detailed resistance network calculation can relax this limitation and the previous assumption on well-sealed shafts. The influence of multiple shafts can also be assembled into an equivalent single shaft through the parallel circuit theory, which is used in electrical circuits.
4.4 Flow Predictions
Equation (2) is useful because it permits one to estimate the infiltration or exfiltration flow rate on any floor based on the total indoor/outdoor pressure difference at that floor and the leakage areas. It is important to note that when the outside pressure is higher than the pressure in an elevator or stair shaft, the flow is negative: outside air will infiltrate the building (e.g., winter conditions below the NPL). When the pressure difference is positive, the flow will leave/exfiltrate the building (e.g., above the NPL in winter). In the winter, the infiltration of outside air will increase the space heating load below the NPL, and in summer, air infiltration will increase the space cooling load above the NPL.
Using equation (2) and assumptions on façade leakage areas and elevator door leakage performance, the infiltration/exfiltration characteristics for the 600-m building described earlier are shown in figures 6 and 7 for winter and summer scenarios, respectively. For these estimates, the pressure distributions for the calm wind conditions in winter and summer were used, along with façade leakage characteristics of 2.19 cm2/m2 acting over 766 m2 of façade and a total elevator leakage area, including doors and walls, of 0.7 m2 per floor.
The plots in Figure 7 are based on a no-wind and no-HVAC scenario. This is not how buildings typically operate.
Figure 8 presents the infiltration predictions for the same building with different wind exposures. The infiltration sum assumes the entire façade is exposed to the windward/leeward and parallel façades. As is seen, the neutral plane shifts significantly depending on the face of the building being considered. On some floors, there is both infiltration and exfiltration. We should note that the calculation has been simplified to assume that the internal pressure is unaffected by the different pressures around the building. This is a reasonable assumption, provided the façade is much tighter than the elevator doors—the façade will take up most of the pressure.
Applying a standard adiabatic lapse rate and standard atmospheric estimate of pressure as a function of height, the predicted infiltration is shown in Figure 8. The results in this image show that the infiltration plot is pushed to the left compared to the prediction without the variable temperature and pressure. The change from a constant to a more complex calculation of outdoor density generates a net increase in indoor-to-outdoor pressure difference.
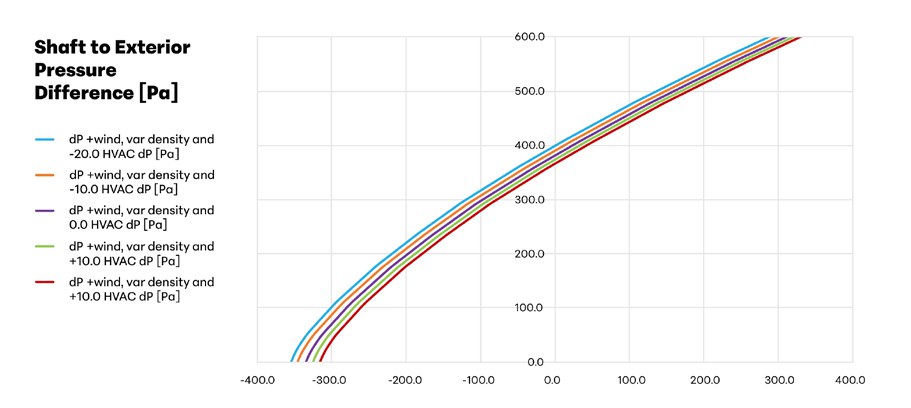
Figure 6— Infiltration (+)/exfiltration (-) flows into the building as a function of floor height [m] in winter.
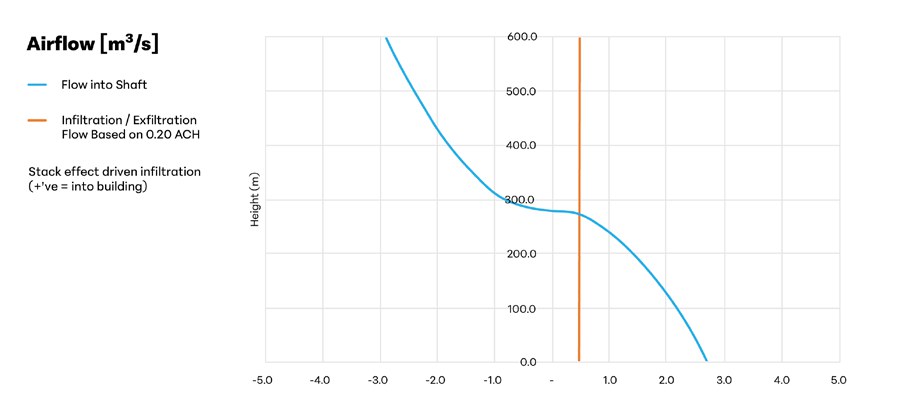
Figure 7— Infiltration (+)/exfiltration (-) flows into the building as a function of floor height [m] in summer.
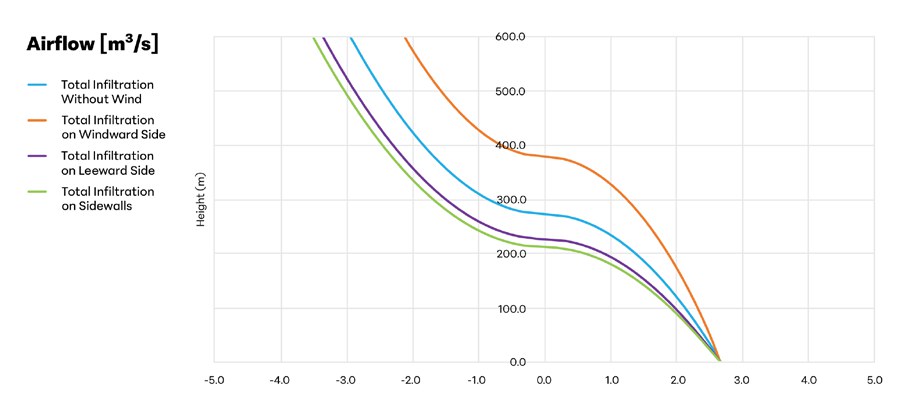
Figure 8— Infiltration (+)/exfiltration (-) flows into the building as a function of floor height [m] in winter with wind impacts alone.
4.4 Energy Analysis
With an estimate of the infiltration on each floor, the heating or cooling demand associated with that outside air infiltrating into the building can be calculated. The energy demand predictions in figures 9 and 10 are based on a simple energy demand equation.
The information in Figure 9 is presented as the “missing” infiltration load if one conducts a “standard” energy analysis. In many “standard” energy analyses, an assumption is made whereby the outside air infiltration rate is assumed to be 0.2 ACH. This assumption is incorporated in energy calculation software’s heating and cooling load calculations for the prototypical building used in this paper. An ACH of 0.2 air changes is approximately 0.5 m3/s for each floor. Therefore, the energy demand in Figure 9 is based on the flow rates in Figure 6. One item that should become apparent is that on some floors, the unaccounted-for infiltration drops to zero, and the assumed 0.2 ACH is larger than the predicted stack effect value.
The calculations presented here are for a standard “cold” and “warm” winter and summer’s day. They are not extreme values. If one sums up the missing energy demand in the two plots, one can estimate the total infiltration-driven building energy demand deficit.
On the design winter day, the total baseline building heating load, excluding infiltration load, is estimated at 5,317+1,164=6,481 kW. When performing a detailed stack effect infiltration calculation, cold outside air infiltrates the entire building at 119.9 m3/s. In the winter, this infiltration will increase the building heating load by 4,316.4 kW, assuming the same conditions as above. The required building heating load, including stack effect-induced infiltration, is 9,633.0 kW, nearly doubling the baseline heating demand.
When the energy demand is positive, hot (potentially humid) outside air infiltrates the building. In the summer, the infiltration (70.1 m3/s) of outside air increases the space’s cooling load, estimated at 648.5 kW on the design day considered here.
Figure 11 presents the infiltrating load during winter when wind and HVAC pressurization are added to the calculations. Since the NPL level drops, there appears to be less infiltration load; however, this comes at the expense of heating and moving the air to pressurize the building.
In addition to wind and HVAC pressurization, the predicted infiltration, and hence infiltration-driven energy demand, is also impacted by the temperature and density assumption. Figure 9 presents the predicted infiltration-driven energy flow using a standard adiabatic lapse rate on temperature, and assuming a standard atmospheric relationship for pressure as a function of height. Note that the change in infiltration load to a function of height for the 0.2 ACH assumed the infiltration rate is associated with the change in temperature as a function of height. The indoor-setpoint-to-outdoor-temperature difference increases.
The pressure differences shown in earlier plots are for each of the individual façades. Figure 11 presents the energy demand driven by infiltration during winter, assuming each side of the building is exposed to the three different wind conditions separately. For example, all four sides of the building are exposed to the “upwind” pressure difference for the upwind calculation. The infiltration calculation assumes that the wind does not distort the internal pressure.
When the infiltration is calculated for each façade independently under the winter temperature and wind conditions described here, using the three different delta-P values, and summed, we get an infiltration load of 4,894.8 kW. The total heating load would be 5,317.0 kW+4,894.8 kW=10,211.8 kW. Comparing the with-wind energy value of 10,211.8 kW and the without-wind value of 9,633.0 kW shows the influence of including a mild wind (4.0 m/s at 10 m) on the calculations.
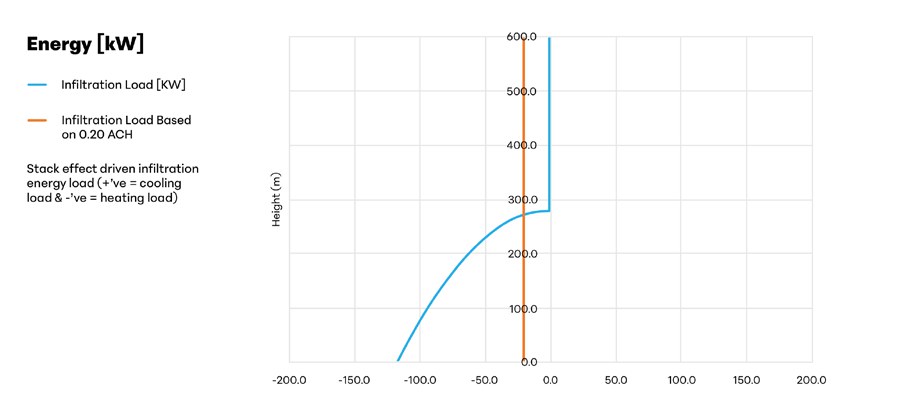
Figure 9— Energy demand on each floor by height [m] in winter associated with infiltration assumption of 0.2 ACH in energy calculations.
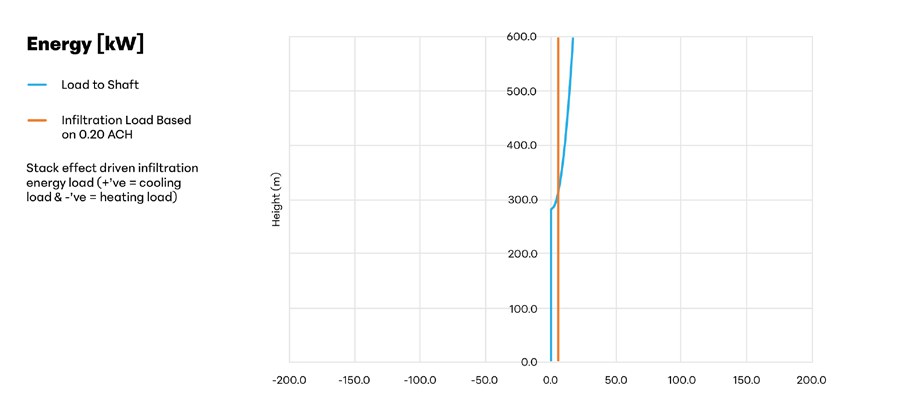
Figure 10— Energy demand on each floor by height [m] in summer associated with infiltration assumption of 0.2 ACH in energy calculations.
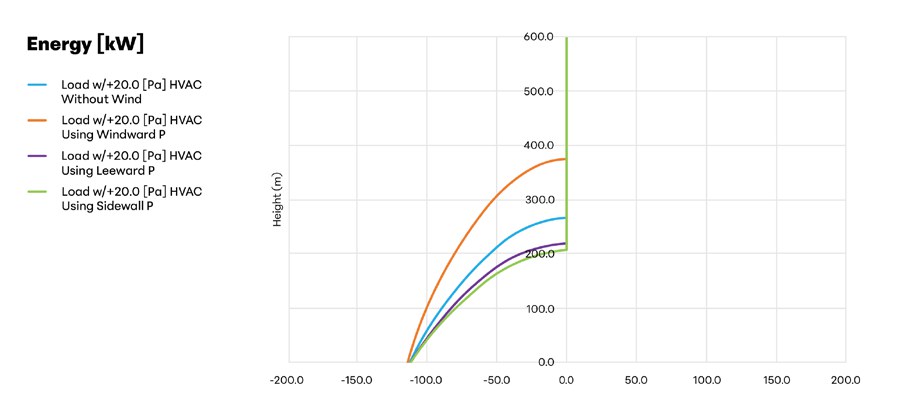
Figure 11— Infiltration energy demand on each floor by height [m] in winter with wind and HVAC.
5. Discussion
Several important topics were noted throughout this paper. These are as follows:
The neutral pressure level (NPL) should be calculated for each project, and the estimate of 0.5 h should not be used for important calculations. The NPL is important, and its calculation is specific to every building. The discussion above has also shown how the NPL can be influenced by different factors (e.g., wind and HVAC pressurization).
The façade’s leakage rate must be clearly defined, as any ambiguity could lead to inefficient energy use.
Wind should be considered in infiltration calculations, but not as a main driver; the main driver will be the stack effect under typical wind conditions.
It is imperative to consider carefully modifying the internal pressure imposed by ventilation systems. This can significantly impact the NPL height and energy efficiency directly (the cost to run the fans) and indirectly (the consequence of changing the NPL height).
The infiltration rate included in load calculations and simulation models must be calculated for each application. The rules of thumb are misleading at best.
Any default infiltration loads driven by the stack effect should be ignored above the NPL in the winter and below the NPL in the summer. That said, wind can cause infiltration and exfiltration on the same floor under some conditions (as shown in plots with the windward and leeward wind pressures), which is ample reason to conduct more detailed calculations on important buildings.
The pressure differential energy demand in the winter can overwhelm the morning warm-up cycle with insufficient heating capacity.
When the neutral pressure level shifts because of the stack effect and wind, this can have an adverse effect on a building’s smoke exhaust systems.
6. Conclusions
The discussion and results above lead to the following conclusions:
When calculating heating and cooling loads for tall, supertall, and megatall buildings, the actual outside conditions, such as temperature, density, and wind at different building heights, must be incorporated into the calculations to reflect the demands on the heating and cooling systems accurately. Commercial and custom software should reflect this.
The critical period is winter at the bottom of the building and summer at the top, as the temperature and relative humidity differentials between internal setpoints and the outside impact different levels and different parts of the building.
The actual air infiltration under design conditions is higher than an assumed 0.2 ACH value, which has clear implications for equipment sizing.
The need for variable outdoor conditions as a function of height for tall buildings implies that ASHRAE or another organization should make these available to designers.
Since higher pressures are across the façade at the top and bottom of a building, it is valuable to ensure that suitable leakage control is specified for the fixed and operable components of the envelope at these extreme ends of the building.
References
- Simmonds, P. (2020). The New ASHRAE Design Guide for Tall, Supertall and Megatall Building Systems Second Edition. ASHRAE.
- ASHRAE. (2021). “Chapter 16 and Chapter 24.” In Fundamentals Handbook 2021. ASHRAE.
- ASHRAE. (2019). “Chapter 4 and Chapter 54.” In Applications Handbook 2019. ASHRAE.
- Nylund, P. O. (1980). Infiltration and Ventilation. Report D22:1980. Swedish Council for Building Research, Stockholm.
- Persily, A. K. and R. A. Grot. (1986). “Pressurization Testing of Federal Buildings.” In Measured Air Leakage of Buildings, STP 904, edited by H. R. Trechsel and P. L. Lagus, p. 184. American Society for Testing and Materials (ASTM).
- Tamura, G. T. and A. G. Wilson. (1966). “Pressure Differences for A Nine-Story Building As A Result of Chimney Effect and Ventilation System Operation.” ASHRAE Transactions 72 (1): 180.
- Tamura, G. T. and A. G. Wilson. (1967a). “Pressure Differences Caused by Chimney Effect in Three High Buildings.” ASHRAE Transactions 73 (2): II.1.1.
- Tamura, G. T. and A. G. Wilson. (1967b). “Building Pressures Caused by Chimney Action and Mechanical Ventilation.” ASHRAE Transactions 73 (2): II.2.1.
- Tamura, G. T. and C. Y. Shaw. (1976). “Air Leakage Data for The Design of Elevator and Stair Shaft Pressurization System.” ASHRAE Transactions 82 (2):179.
- Simmonds, P. and Phillips, D. (2021). “The Influence of Outdoor Conditions on the Heating and Cooling Loads of Supertall and Megatall Buildings.” Paper presented at CIBSE Technical Symposium, United Kingdom, 13-14 July 2021.
- Jalayerian, M. and Jensen, T. (2023). Stack Effect in Tall Buildings. CTBUH.
- Simmonds, P. and Phillips, D. (2022). “Determining the Infiltration and Exfiltration in Supertall and Megatall Buildings.” Paper presented at REHVA 14th HVAC World Congress, 22-25 May 2022, Rotterdam, The Netherlands.
- Simmonds, P. and Phillips, D. (2022). “Infiltration/Exfiltration of a Building’s Façade.” Paper presented at PowerSKIN Conference, 2022.
- Phillips, Duncan A. (2021). “Managing Infiltration in Tall Buildings to Control Energy Loss, Minimize Pathogen Transport and Enhance Air Quality.” Paper presented at the ASHRAE Conference, Seminar 75, January 2021.
- Phillips, D. (2014). Personal Correspondence.
Publication
Price:
You have added this page to your collection.
You can view or share your full collection.