Resources
Research
Research Papers
Paper

The Economics of Record-Breaking Height

No alt text found

1 / 10

Abstract

This paper reviews the development history of record-breaking skyscrapers to better understand their economics. Given how tall they are, the supposed reason for their construction is “ego” or “vanity.” The research presented here shows that nearly all the record-breakers have had a strong economic rationale. This is not to say they are necessarily profit-maximizing based on a strict theoretical notion of “economic height,” but rather, their returns typically outweigh their costs. To the degree that “ego” or “vanity” is at work, it is financed by profits. Over time, the measurement of the benefits of record-breakers has changed from a direct return on investment (ROI) perspective to the broader goal of placemaking and internalizing the positive spillovers to surrounding land values.

Keywords: Height, Investment, Supertall

Introduction

This paper reviews the past, present, and future of the record-breaking skyscraper (RBS) to better understand its economic justifications. The result of this exercise shows that they nearly all have a strong economic grounding. That is, their revenues, along with the implementation of cost-saving innovations mean the world’s tallest buildings generally have strong economic foundations. This is not to say they are necessarily profit-maximizing based on a strict theoretical notion of “economic height” (Willis 1995), but it is to say that their returns typically outweigh their costs. To the degree that “ego” or “vanity” is at work, it is compensated by the profits that these structures generate. Over time, however, the measurement of the benefits of record-breakers has changed from a direct return on investment (ROI) perspective to a broader rationale of both placemaking and the ability of developers to “internalize” the positive spillovers to surrounding land values.

A History of Height

Based on collected data, Figure 1 shows that since 1890, the height of the tallest skyscraper completed each year has risen at an annual rate of 1.22 percent, on average. Since 1980, the growth rate has been 1.80 percent. Thus, the height growth rate appears to have sped up. Looking at the world’s record holders shows a similar pattern. Even though record-breakers are relatively rare—only 12 since 1890—they have grown on average at a smoothed rate of 1.24 percent per year, which gives an average RBS height doubling time of about 56 years. These statistics suggest that skyscrapers will continue to get taller throughout the 21st century.

As a side note, the role of mainland China is nuanced. On the one hand, the height of the tallest buildings completed each year outside China has grown at a slightly slower rate of 1.16 percent. On the other hand, China has never completed the world’s tallest building, so the RBS growth rate remains unaffected.

Figure 1. The height of the tallest building completed each year, compared against the height of the world’s tallest buildings. Source: CTBUH.

Figure 1. The height of the tallest building completed each year, compared against the height of the world’s tallest buildings. Source: CTBUH.

Height Cycles
Record-breaking structures generally fit within a techno-economic cycle. New and improved technologies are constantly being developed. Their newness, however, means that they get adopted first as “test cases” on shorter buildings. When the technology proves itself, it is adapted for use in the world’s tallest buildings. Then, as these innovations spread more widely, the height of “ordinary” tall buildings catches up to the RBS height. At this point, a new suite of technologies is needed to overcome the height “bottleneck,” and the cycle repeats itself.


Figure 2 shows the (smoothed) difference between the current RBS at the time minus the height of the tallest building for each respective year. The circles show the year of a new record-breaker. Upward movements in the graph show relatively bad economic times when the tallest buildings are getting less tall (thus increasing the gap). The figure demonstrates that when the economy is on an upswing, the tallest buildings tend to catch up to the record breakers, and then get closer to creating a bottleneck that spurs the next round of innovations.


Competition and Preemption

More broadly, among the world’s tallest buildings, there is an assumption that a city or region’s tallest building is a product of height competition or the desire to stand out to advertise the developer. If these tall buildings are not tied to the local economic situation “on the ground,” then there should be little relationship between a city’s tallest building and its second-tallest building.


However, comparing the two across 859 cities around the world as of 2020 shows a very strong correlation (ρ=0.93). While some cities have buildings that are “too tall” compared to the second-tallest, the fact that, on average, one can strongly predict the height of the tallest building using the second-tallest building (and vice versa) suggests that the tallest buildings are not wholly unmoored from their underlying economics. Across the sample, the average percentage difference between the tallest and second-tallest buildings is only 22 percent, but the median percentage difference is 11 percent. The standard deviation is 36 percent (see Figure 3).


Next, we turn to an analysis of the economics of the RBS since 1890.

Figure 2. The height of the world’s tallest building minus the tallest building completed each year, (and a 3-year moving average). Circles indicate a new record-breaking skyscraper. Source: CTBUH.

Figure 2. The height of the world’s tallest building minus the tallest building completed each year, (and a 3-year moving average). Circles indicate a new record-breaking skyscraper. Source: CTBUH.

Figure 3. The height of the tallest building versus the height of the second-tallest building, in 859 cities around the world, as of 2022. Note: For 15% of the cities, the tallest and second tallest are the same height. Source: CTBUH.

Figure 3. The height of the tallest building versus the height of the second-tallest building, in 859 cities around the world, as of 2022. Note: For 15% of the cities, the tallest and second tallest are the same height. Source: CTBUH.

Period I: 1890–1960

By the early 1890s, all the key ingredients that created skyscrapers emerged. Most important was the riveted-steel, moment-resisting frame, which allowed buildings to resist the lateral forces (mostly wind, but also seismic). Electric elevators (with safety brakes) made vertical transportation safe and fast (Condit 1986).


During the second half of the 19th century, rents were rising given the demand for office space. Developers satisfied this demand by erecting tall buildings in the downtowns across American cities, most notably New York and Chicago. However, in 1893, Chicago limited its building heights to 130 feet (39.6 meters), whereas New York did not.


Both developers and businesses in New York realized the strong advertising power of skyscrapers, which created incentives to add height, to not only satisfy the demand for office space but also to signal the power of the occupants and builders (Wallace 2006).

Between 1890 and World War I, six buildings in New York City each claimed the prize of “World’s Tallest”: the World Building (1890), the Manhattan Life Insurance Building (1892), the Park Row Building (1899), the Singer Building (1908), the Metropolitan Life Tower (1909), and the Woolworth Building (1913) (see figures 4 and 5).

Figure 4. The world’s tallest buildings constructed before 1900. From left to right: New York Tribune Building (79 m, 1875), Pulitzer (World) Building (94 m, 1890), Manhattan Life Insurance Building (106 m, 1894), and Park Row Building (119 m, 1899)—all in New York City.

Figure 4. The world’s tallest buildings constructed before 1900. From left to right: New York Tribune Building (79 m, 1875), Pulitzer (World) Building (94 m, 1890), Manhattan Life Insurance Building (106 m, 1894), and Park Row Building (119 m, 1899)—all in New York City.

Figure 5. The world’s tallest buildings constructed in the first two decades of the 1900s. From left to right: Singer Building (187 m, 1908), Metropolitan Life Tower (213 m, 1909), and the Woolworth Building (241 m, 1913)—all in New York City.

Figure 5. The world’s tallest buildings constructed in the first two decades of the 1900s. From left to right: Singer Building (187 m, 1908), Metropolitan Life Tower (213 m, 1909), and the Woolworth Building (241 m, 1913)—all in New York City.

Each was built by a for-profit developer, and five were built as headquarters for a large corporation. While each developer no doubt aimed to have their building rise above the others, height competition was within the context of a free market, with no government intervention or support. Return on investment (ROI) was the main criterion to judge profitability.


The period from 1913 to 1921 was uncertain economically because of World War I and multiple recessions. But the growth of office rents during the 1920s gave rise to taller and taller structures (Barr 2016). By 1928, heady optimism produced the next round of record-breakers. First was the Bank of Manhattan Building (40 Wall Street) (1930), followed quickly by the Chrysler Building (1930), and the Empire State Building (1931) (see Figure 6).


Economic Analysis
The common assumption is that these record-breakers were monuments, not money-makers. However, research into the ROI of several of the buildings reveals that, on average, their expected returns were quite reasonable. Because it is virtually impossible to get actual income and cost data for these buildings, ROIs were estimated based on expected rents that were either announced by the developer or were typical for the day. Further, land prices, construction costs, and operating costs were estimated using historical sources (Barr 2020).

Figure 6. The world’s tallest buildings constructed in the 1930s. From left to right: Bank of Manhattan Building (40 Wall Street) (283 m, 1930), the Chrysler Building (319 m, 1930), and the Empire State Building (381 m, 1931)—all in New York City.

Figure 6. The world’s tallest buildings constructed in the 1930s. From left to right: Bank of Manhattan Building (40 Wall Street) (283 m, 1930), the Chrysler Building (319 m, 1930), and the Empire State Building (381 m, 1931)—all in New York City.

Table 1 shows that at the time of their completion, the expected returns were 8 percent on average (assuming no financing costs). None were below 5 percent, which was considered a reasonable benchmark for the profitable use of funds (Clark and Kingston 1930).


This analysis includes the Empire State Building. At the time of its construction, its economics were, in fact, quite favorable. The emergence of the Great Depression then created the legend of it being a foolhardy investment—the so-called “Empty State Building.” But the severity and length of the Great Depression were utterly unforecastable. To make an analogy, it’s as if a developer today were maligned for opening a skyscraper at the height of the Covid-19 pandemic because they failed to see it coming when the project was greenlighted in 2018.

Table 1. Estimated return on investment (ROI) for New York City record-height-breaking buildings from 1890 to 1931. Source: Barr (2020).

Period II: 1960–1990

Period II was a transitional period for the RBS. On the cost and engineering side, a series of structural innovations—made possible by the rise of mainframe computing—allowed buildings to get taller, while using less material.


Skidmore, Owings & Merrill (SOM) structural engineer Fazlur Khan popularized the notion of the “premium for height,” which showed

that as buildings became taller, the amount of steel needed to resist lateral loads in a moment-resisting frame increased at an exponential rate, thus driving up the construction costs (Ali 2001).


Engineers, such as Khan and Leslie Robertson, devised solutions to this economic problem. Arguably, the most important was the tube, in which the lateral (and gravity) loads were withstood by placing closely-spaced columns connected by deep spandrels around the perimeter. These innovations made skyscrapers both lighter and more economical. For example, the Empire State Building’s steel weighed 42 pounds per square foot of floor area (205 kg/m2), while the Sears (Willis) Tower steel averaged only 33 pounds per square foot (161 kg/m2) (Baker 2001).


Robertson used the tube design for the World Trade Center (1972/3), while Khan’s design for the Sears (Willis) Tower (1974) was a bundled tube. In this case, nine smaller tubes were connected to form one larger, stiffer megastructure (see Figure 7).

Figure 7. The world’s tallest buildings in the 1970s. From left to right: One World Trade Center (417 m, 1973) and Two World Trade Center (415 m, 1973), New York City and Sears (now Willis) Tower, Chicago (442 m, 1974).

Figure 7. The world’s tallest buildings in the 1970s. From left to right: One World Trade Center (417 m, 1973) and Two World Trade Center (415 m, 1973), New York City and Sears (now Willis) Tower, Chicago (442 m, 1974).

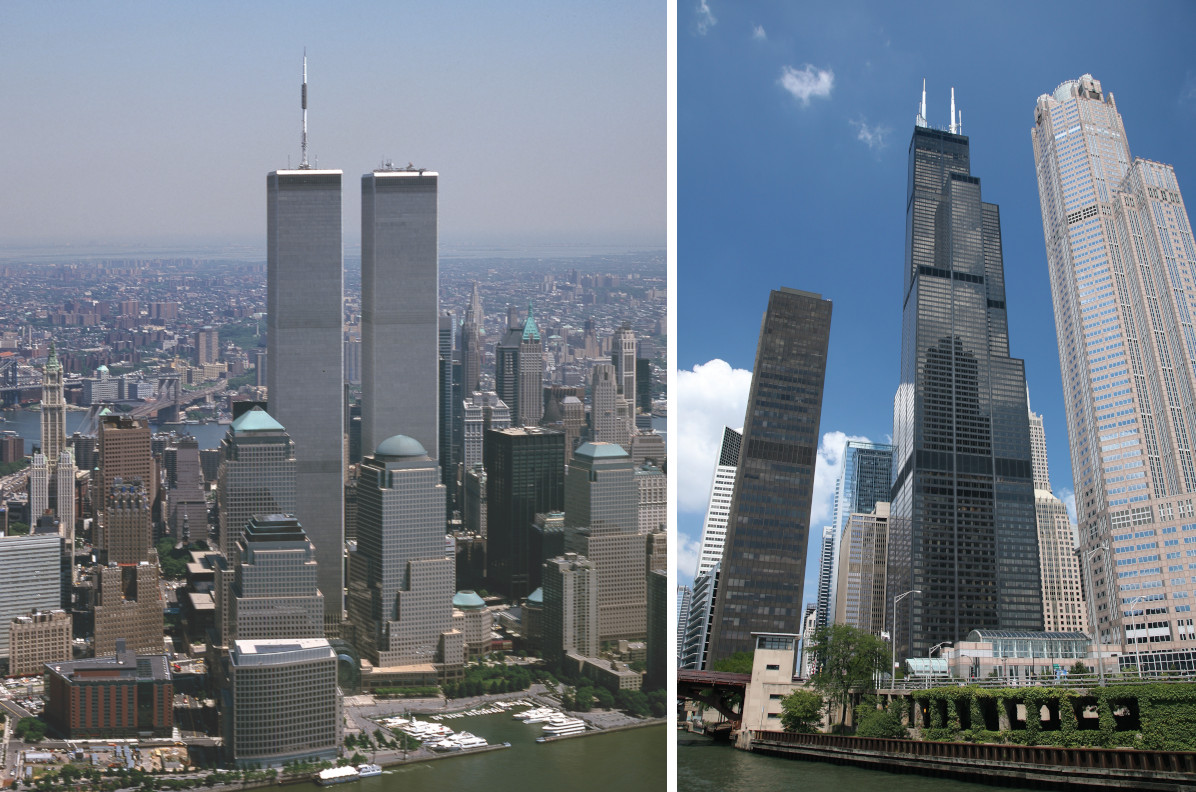
The Sears (Willis) Tower was the last of the “free market” RBSes, in the sense that it was constructed as a corporate headquarters and its height was based on the needs of the corporation. In the late 1960s, Sears, Roebuck & Co. wanted a new headquarters to centralize its staff, while also having extra space to use in the future. The bundled tube design, along with a large lot and generous zoning regulations, meant that it could get the world’s tallest building simply based on the underlying economics.

The World Trade Center’s twin towers, on the other hand, were built by a government agency when municipal and state governments were attempting “urban renewal” programs. The World Trade Center was proposed to revitalize lower Manhattan. New York State turned to the Port Authority (PA) of New York as an independent government entity that had the financial and engineering might to effectuate it. Under the auspices of PA Director Austin Tobin, the project was expanded to 13.63 million square feet (126,6270 square meters), along with a plan to produce the world’s tallest twin towers (Gillespie 1999).


Economic Analysis

The main lessons were not just on the structural side, but also regarding their economics. The Sears (Willis) Tower was built to accommodate its present and future expected demand for 3.7 million rentable square feet (343,741 square meters) of space. Additionally, Sears wanted very large floor plans on the lower floors for its phone banks and mail-order business. While they served the company at the time, the space was cavernous and had little sunlight in the interiors, which, unwittingly, dampened its future economic value.

Similarly, in the early 1970s, when opened, the Twin Towers put on the market vast quantities of rental space. Even though the buildings were meant to house international trade concerns, New York’s port-related jobs were declining. To help fill the buildings, the Port Authority turned to government agencies to pick up the slack, with New York State renting some 20 percent of the total space (Fusscas 1992). The World Trade Center contributed to an office glut in the mid-1970s (Horsely 1974).

The combined factors of the “slum clearance” process, its impact on the rental market, and government agencies filling the buildings, meant that the Twin Towers were clouded in controversy, and dampened the appetite for future American record-breakers.

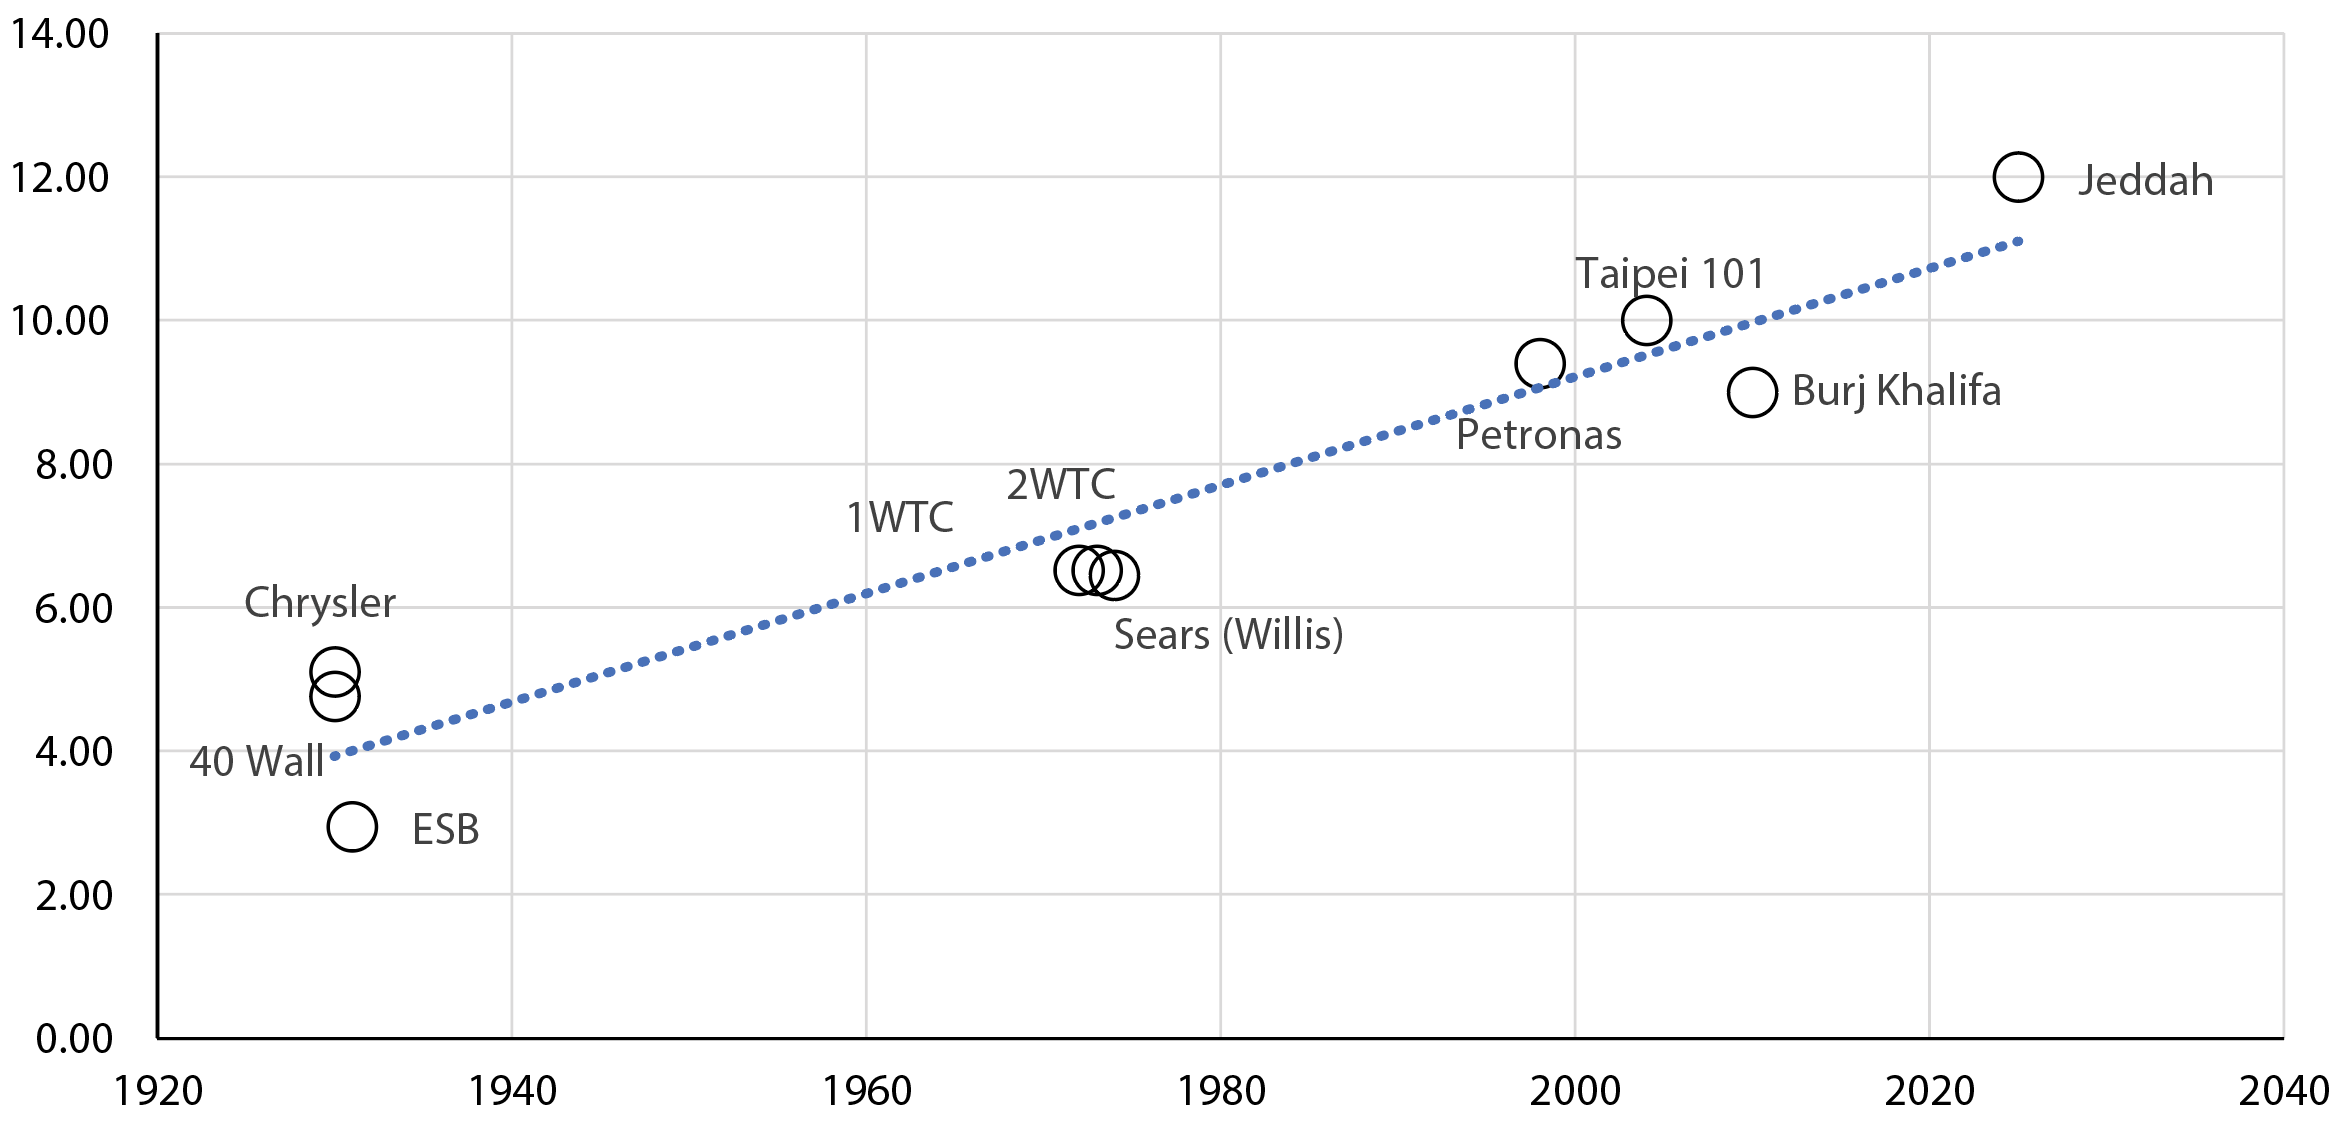
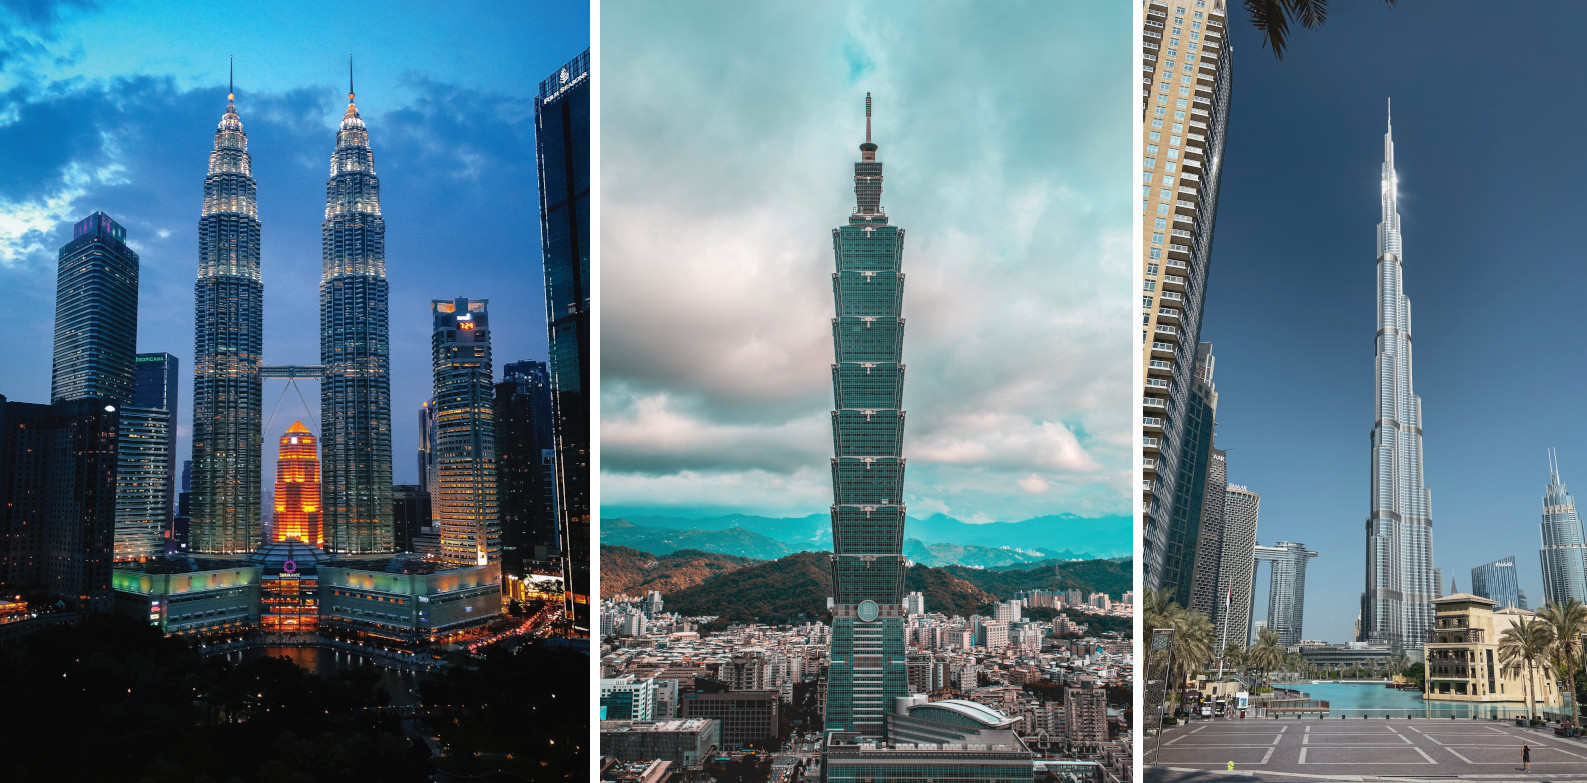
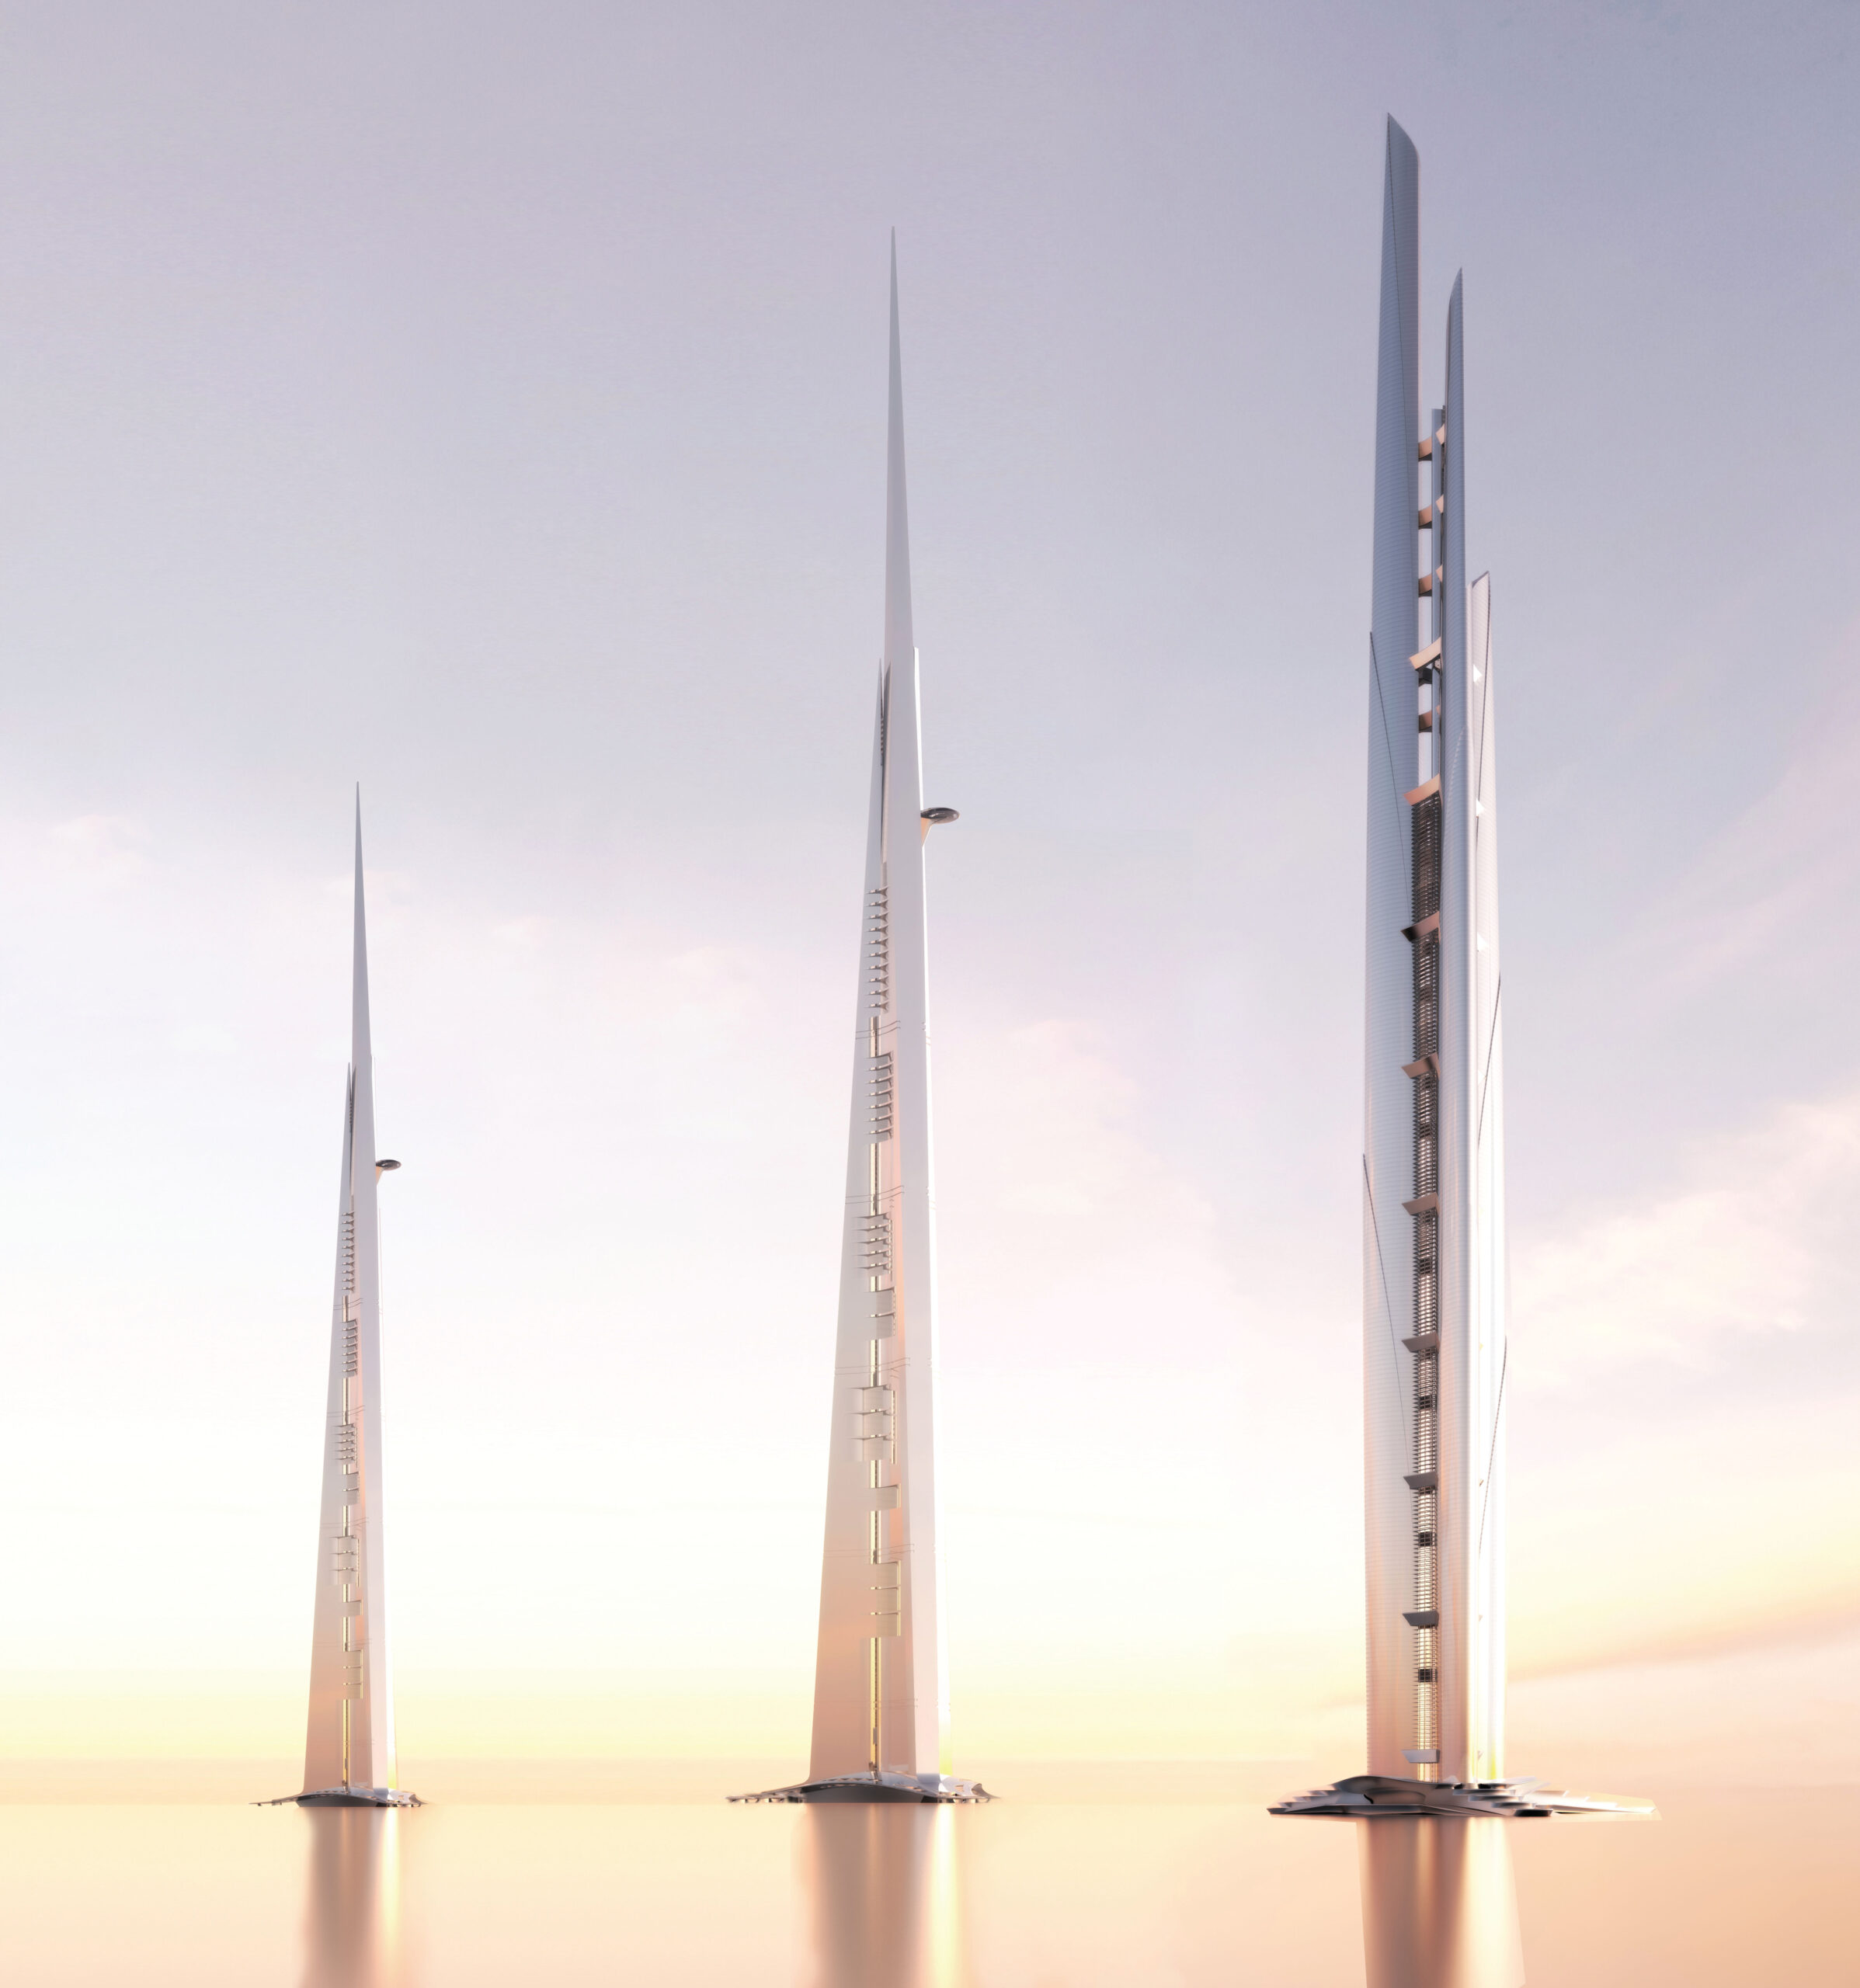
Another lesson was that if buildings were going to be taller, they would have to get thinner to keep costs manageable and to limit the “self-sabotaging” nature of mega-sized skyscrapers. The Empire State Building and Chrysler Building have aspect ratios (the height divided by the width at the base) of 3:1 and 5:1, respectively. The Sears Tower and each of the Twin Towers were about 6.5:1. The Petronas Towers (1998), the TAIPEI 101 (2004), and the Burj Khalifa (2010) are all 9:1 or higher. The Jeddah Tower, before being placed on hold, was expected to have an aspect ratio of 12:1 (see Figure 8).

However, looking back over the long run, economically speaking, the Twin Towers were a success. By 1989, the World Trade Center was earning a gross operating income of over US$110 million per year, more than one-third of the Port Authority’s total operating income. The Twin Towers also rented at a premium compared to similar buildings downtown (Fusscas 1992.)

The decline of Sears’ profitability in the 1980s, along with a general office glut in the 1990s meant that the Sears Tower was consistently under-rented. Sears defaulted on its building in 1994. In 2009, the new owners made a deal with the Willis Group, a London-based insurance broker, which purchased the naming rights and rented a large block of space.

In 2015, in a show of optimism, the Blackstone Group, a private equity firm, purchased the building for US$1.5 billion, the highest price ever paid for a Chicago skyscraper. Blackstone put in another US$670 million for an upgrade, and today the building is holding its own, even during the pandemic (Gallun 2022).

Quote pattern

Asian countries embraced skyscrapers as part of their economic development strategies, with the aim of placemaking, attracting foreign direct investment (FDI), tourism, and putting a country ‘on the map.

Period III: 1990–2010

The success of the Twin Towers as urban renewal icons, however, helped set the stage for the next crop of RBSes. Asian countries embraced skyscrapers as part of their economic development strategies, with the aim of placemaking, attracting foreign direct investment (FDI), tourism, and putting a country “on the map.” This period saw three record-breakers: The Petronas Towers (1998), The Taipei 101 (2004), and the Burj Khalifa (2010) (see Figure 9).

Higher-strength concrete mixes were developed to gain the advantages of reinforced concrete cores used for lateral load resistance, and to allow Asian countries to build taller where their steel industries were less developed. One of the key lessons learned in this period was that if an RBS is built within a larger planned development, the external benefits of the structure can be “captured” locally by the owners of surrounding properties (often the same developer). All three projects were the centerpieces of new “downtown” neighborhoods meant to both boost surrounding land values and advertise each city’s global orientation.

Besides the use of high-strength concrete, additional innovations include the use of outriggers (often with belt trusses) that generally extend to megacolumns, along with tuned mass dampers (TMDs) and wind-tunnel testing. Improvements in elevator equipment design and computer-assisted operation made vertical transportation cheaper and more efficient (Al-Kodmany 2015).

The Petronas Towers emerged on the site of a former racing track, the Selangor Turf Club, underutilized land in a central area (Ibrahim and Leong 2015). In the 1980s, local officials initiated an international master plan competition to redevelop the site as a commercial center that would also showcase Malaysia’s economic success. Today the Kuala Lumpur City Centre (KLCC) is a thriving neighborhood. Cesar Pelli was commissioned to design the headquarters for Petronas, the state-owned oil company, and he created a new set of record-breaking twin towers, whose architectural height was 1,483 feet (451.9 m), though its highest floor was still below that of the Sears Tower.

Figure 8. Aspect ratios of world record-breaking skyscrapers since 1930, calculated as the height of the building divided by the width at the base. Sources: Heights are from the CTBUH database. Base widths or aspect ratios are from various sources available upon request to the authors.

Figure 8. Aspect ratios of world record-breaking skyscrapers since 1930, calculated as the height of the building divided by the width at the base. Sources: Heights are from the CTBUH database. Base widths or aspect ratios are from various sources available upon request to the authors.

The Taipei 101 was also built on underutilized land—a former military base—and has become the centerpiece of the Xinyi Planning District, near Taipei City Hall (Jou 2006). As Jou writes, “this newly created urban center has been purposefully promoted and imaged by the Taipei City government as a miniature of New York’s Manhattan, a response to global-city competition and network-building.” The Taipei 101 emerged out of Taipei’s former mayor, and subsequent Taiwan president, Chen Shui-bian’s desire to have the world’s tallest building.

Echoing the development of both the KLCC and Xinyi, in 1997, Emaar Properties acquired from the government an abandoned military base southwest of what was the 1970s commercial center of Dubai. As Emaar executive Mark Amirault has said, “We looked at the success of KLCC. Not only did they build the Petronas Towers, but they added in a major shopping center, a large man-made lake and park, [and] a hotel, and created the new center of Kuala Lumpur” (Halpern 2007). The Burj Khalifa was built with the relatively innovative structure of the buttressed core—three concrete wings “buttress” the central core to provide lateral stiffness.


Economic Analysis

The Petronas Towers and the Taipei 101 are primarily office towers (with concrete cores, external megacolumns, and outriggers). The success of their master-planned neighborhoods has helped to contribute to the success of each of these buildings. The occupancy rate of the Taipei 101 is regularly above 90 percent (Taipei Times 2021). The Burj Khalifa is mixed-use, though primarily residential. Before the 2008 financial crisis, some 70 percent of residential units were prepurchased.

Each of these towers has an observation deck. The Burj Khalifa’s observation deck, for example, takes in US$150–200 million in revenues each year. The estimated construction cost of the tower was US$1.5 billion. If the building was only an observatory, the ROI would likely be above five percent (Rahman 2019, Wikipedia 2023). The spillover to increased land values is also important. An analysis of recent sales data suggests that having a Burj view increases the value of a residential unit by about 14 percent on average.

Figure 9. The world’s tallest buildings from the 1990s to the present. From left to right: Petronas Towers, Kuala Lumpur (452 m, 1998), Taipei 101, Taipei (508 m, 2004), and Burj Khalifa, Dubai (828 m, 2010).

Figure 9. The world’s tallest buildings from the 1990s to the present. From left to right: Petronas Towers, Kuala Lumpur (452 m, 1998), Taipei 101, Taipei (508 m, 2004), and Burj Khalifa, Dubai (828 m, 2010).

Period IV: 2010–Present

Today there are plans for buildings as high as 2 kilometers. This next generation of RBS, however, will not likely be a radical shift in technology but rather an incremental improvement. The structure of the world’s next-tallest building will likely be either a buttressed core or a co-joined tower, based on projects currently under construction.

Jeddah Tower
Jeddah Tower began construction in 2013 and is currently stalled at approximately the 67th floor. At the time of this writing, no formal plans have been announced about restarting construction. However, given the work that has been put into it thus far, it’s likely it will eventually be completed. The anticipated final height is approximately 1 kilometer.

The design is a variation on the buttressed core, or as chief engineer Robert Sinn calls it, a “bearing wall” design, since there are no outriggers and the all-concrete walls are used to bear both vertical and horizontal loads (Weismantle and Stochetti 2013).

To maximize the return on investment, the Jeddah Tower will be mixed-use and can be likened to a small city, but arranged vertically. It contains residences, offices, hotels, restaurants, retail shops, amusement areas, and all ancillary spaces and equipment necessary for the revenue-generating program to function properly.

To make elevating more efficient, the building will take advantage of skylobbies and innovative use of the shafts. Groups of high-speed shuttle elevators will go to the residential sky lobbies where passengers transfer to local elevators. The locals in the upper zones are in the same position as the locals in the lower zones, because the multi-story technical floors are below each skylobby. The height of the technical floors allows for the pit of the upper local elevators to be positioned directly over the machine room serving the lower locals. In this way, the building can recapture shaft space, allowing more than 50 elevators to be located in the 18 shaft spaces.

The travel distance in the observatory shuttles is over 2,100 feet (640 meters). With the development of UltraRope, a cable with a carbon-fiber core, the Finnish manufacturer KONE has cut the weight of the cables to a fraction of what is required for steel; thereby opening the possibility of an elevator to a travel distance of 1 kilometer and beyond.

Economic Considerations

The Jeddah Tower was planned to have a total gross floor area of approximately 2.6 million square feet (250,000 square meters) (see Figure 10). Because it tapers as it gets taller (and has a large spire), its total square footage is only 23 percent greater than the Taipei 101, which is half as tall at 508 meters. Ultimately, the economics of the Jeddah Tower, if completed, will depend not only on the total revenue it generates, but also on its impact on the surrounding properties within the Jeddah Economic City, a 1,286-acre (520-hectare) master-planned development. The cachet of owning a unit in the building, the revenues from the observation deck, the positive externalities to surrounding land values, as well as the extra tourism revenue, suggest a completed Jeddah Tower would be an economic success.

Figure 10. Three versions of Jeddah Tower. Left: rendering of current structure, for which construction is on hold (1,000 m). Middle: Rendering of a mile-high (1,620-meter) version of Jeddah tower. Right: Rendering of a co-joined mile-high (1,620-meter) tower. Source: Peter Weismantle of Adrian Smith + Gordon Gill Architecture.

Figure 10. Three versions of Jeddah Tower. Left: rendering of current structure, for which construction is on hold (1,000 m). Middle: Rendering of a mile-high (1,620-meter) version of Jeddah tower. Right: Rendering of a co-joined mile-high (1,620-meter) tower. Source: Peter Weismantle of Adrian Smith + Gordon Gill Architecture.

Conclusion

This paper has reviewed the past, present, and future of the record-breaking skyscraper. The height of record-breaking skyscrapers has grown (at a smoothed rate) by about 1.24 percent per year on average since 1890. An economic analysis of the first generation of record breakers (1890 to 1931) shows that their expected returns on investments were all quite favorable. Since the 1960s, the economics of the RBS has also been about placemaking and internalizing the spillover benefits from the buildings. For example, the Petronas Towers, the Burj Khalifa, and the Jeddah Tower (if completed) are at the center of planned developments owned by one company.

References

Khan. New York: Rizzoli International Publications.

Al-Kodmany, K. (2015). “Tall Buildings and Elevators: A Review of Recent Technological Advances.” Buildings 5 (3): 1070–104.

Baker, W. (2001). “Building Systems and Concepts – Structural Innovation.” In CTBUH 2001 6th World Congress, Conference Proceedings.

Barr, J. M. (2020). “Why Doesn’t New York Construct the World’s Tallest Building Anymore?” https://buildingtheskyline.org/nyc-record-breaking-skyscrapers/.

Barr, J. M. (2016). Building The Skyline: The Birth and Growth of Manhattan’s Skyscrapers. New York: Oxford University Press.

Clark, W. C. & Kingston, J. L. (1930). The Skyscraper: A Study in the Economic Height of Modern Office Buildings. New York: American Institute of Steel Construction, Inc.

Fusscas, A. F. (1992). The New York World Trade Center: A Performance Study. Masters dissertation, Massachusetts Institute of Technology (MIT).

Gallun, A. (2022). “The Willis Tower’s $670 Million Makeover.” UrbanLand. https://urbanland.uli.org/development-business/the-willis-towers-670-million-makeover/.

Gillespie, A. K. (1999). Twin Towers, The Life of New York City’s Trade Center. Piscataway: Rutgers University Press.

Halpern, D. (2007). “Arabian Heights.” Architect Magazine. https://www.architectmagazine.com/design/urbanism-planning/arabian-heights_o.

Ibrahim, F. & Leong, P. K. (2015). “Petronas Towers and KLCC: Urban Catalyst.” In Asia & Australasia, edited by Antony Wood & Alannah Sharry: 100–07. Chicago: Council on Tall Buildings and Urban Habitat.

Jou, S. C. (2006). “Domestic politics in urban image creation: Xinyi as the ‘Manhattan of Taipei’. ” In Globalizing Taipei, edited by Reginald Yin-Wang Kwok: 120–40). London: Routledge.

Moon, K. S. (2018). “Developments of Structural Systems Toward Mile-High Towers.” International Journal of High-Rise Buildings 7 (3): 19–214.

Rahman, F. (2019). “Emaar Says It is Not Selling Observation Decks at Burj Khalifa.” The National News. https://www.thenationalnews.com/business/emaar-says-it-is-not-selling-observation-decks-at-burj-khalifa-1.955624.

Taipei Times. (2021). “Occupancy Rate of Taipei 101 at 96% Despite Pandemic Slump: TFCC.” Taipei Times. https://www.taipeitimes.com/News/biz/archives/2021/03/15/2003753833.

Wallace, A. (2006). “A Height Deemed Appalling: Nineteenth-Century New York Newspaper Buildings.” Journalism History 31 (4): 178–89.

Weismantle, P. & Stochetti, A. H. (2013). “Kingdom Tower, Jeddah: Meeting the Challenges of a One-Kilometer Tower.” CTBUH Journal 2013 Issue I: 12–9.

Wikipedia. (2023). “Burj Khalifa.” Accessed January 2023. https://en.wikipedia.org/wiki/Burj_Khalifa.

Willis, C. (1995). Form Follows Finance: Skyscrapers and Skylines in New York and Chicago. New York: Princeton Architectural Press.

90 Degree Logo

90 Degree

Unlock new levels of knowledge.

Explore our entire research archive and its vast collection of documents, reports, and multimedia resources. Hosted on the Engage platform, it is a treasure trove of new ideas and proven best practices.

Go to Engage

You have added this page to your collection.

You can view or share your full collection.